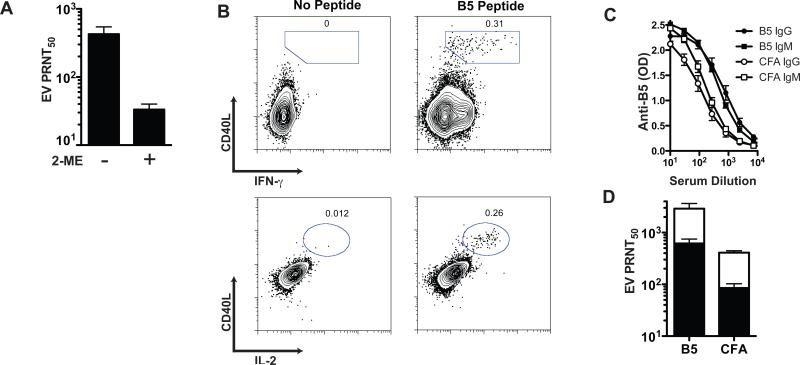
Figure 5. Neutralizing anti-EV VacV IgM.
(A) PRNT50 [EV] from sera of WT mice at day 7 post-VacV infection, plus 2-ME (IgM depleted) or minus 2-ME (total antibodies). (B) Intracellular staining of CD4 T cells at day 12 after priming with a VacV class II restricted peptide (B546-60). Graphs are from gated CD4+ CD62Llo lymphocytes. Splenocytes stimulated with B546-60 peptide or without peptide (negative control) for each staining is shown, numbers in the plots indicate the frequency of the gated population in relation to total CD4+ T cells. (C) Anti-B5 IgM and IgG ELISA from sera of primed mice at day 7 post-VacV infection. IgM (squares) and IgG (circles) were measured from B546-60 primed mice (closed symbols) and no peptide control mice (open symbols). Anti-B5 IgM in B5 primed vs. CFA primed mice, P < 0.0008. Anti-B5 IgG in B5 primed vs. CFA primed mice, P < 0.0002. (D) PRNT50 [EV] from sera of B546-60 primed or control mice (n = 4). Total (white bars) and IgM depleted sera (black bars) is shown. Error bars represent SEM. Results are representative of 4 independent experiments.

