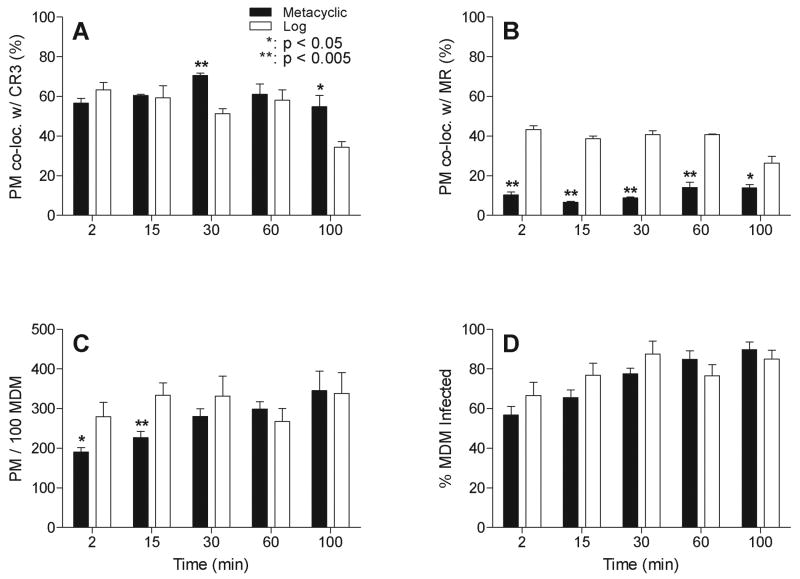
Figure 6.
Quantitative analysis of receptor co-localization with promastigotes. (A and B) Co-localization was scored and quantified for more than 200 phagocytosed parasites at each time point for each parasite type as described in the Experimental Procedures. The percent of metacyclic or logarithmic promastigotes co-localizing with CR3 (A) or MR (B) was calculated. Black bars: mean ± SE of 4 representative assays with metacyclic promastigotes. White bars: mean ± SE of 3 representative assays with logarithmic promastigotes. (C and D) The parasite load after phagocytosis of metacyclic or logarithmic stage promastigotes is shown as parasites per 100 MDMs (C) and the percent of MDMs with associated parasites over total MDMs (% MDM Infected) (D). Black bars: mean ± SE of 8 representative assays with metacyclic promastigotes. White bars: mean ± SE of 6 representative assays with logarithmic stage promastigotes. *: p < 0.05, **: p < 0.005. Statistical analyses utilized the one-tailed t test with 95% confidence.

