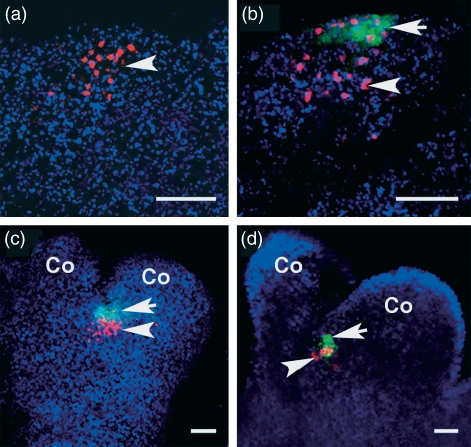
Figure 3.
Relative expression domains of WUS and CLV3 by confocal laser scanning microscopy. (a) WUS signals (red) in SEIM at 24 h (arrowhead). (b) CLV3 (green, arrow) and WUS (red, arrowhead) signals in the somatic embryo at 2 days. (c, d) Both CLV3 and WUS signals localized within the SAM of the somatic embryo. Co, cotyledon. Scale bars = 60 μm.

