Figure 4.
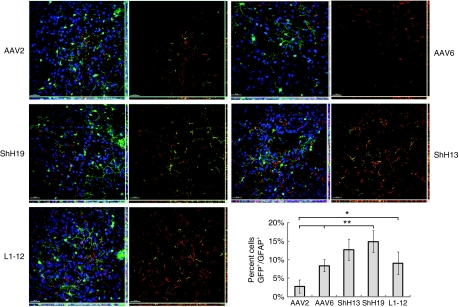
Enhanced in vivo astrocyte tropism of evolved AAV variants. Representative images of coronal brain sections 3 weeks after injection with dsCAG-GFP vectors using capsids from AAV2, AAV6, ShH13, ShH19, and L1-12 show robust levels of GFP expression (green). Representative images (original magnification ×25) of cell types reveal enhanced astrocyte transduction levels by ShH19 (P < 0.01 compared to AAV2/6), and L1-12 (P < 0.02 compared to AAV2) compared to the parent AAV2 and AAV6 vectors: GFP+ cells (green), NeuN+ neurons (blue), and GFAP+ astrocytes (red). For each variant, the image on the right indicates areas of colocalization between GFP and GFAP (yellow). The corresponding x-z and y-z planes are shown on the bottom and on the right side, respectively, for each image. Bar = 50 µm. Quantified percentage of astrocytes transduced (GFP+/GFAP+) within the total GFP+ cell population (n = 4, error bars represent SD). For each vector, over 950 GFP+ cells were counted and analyzed for costaining with either NeuN (neuron) or GFAP (astrocytes). AAV, adeno-associated virus; GFP, green fluorescent protein.

