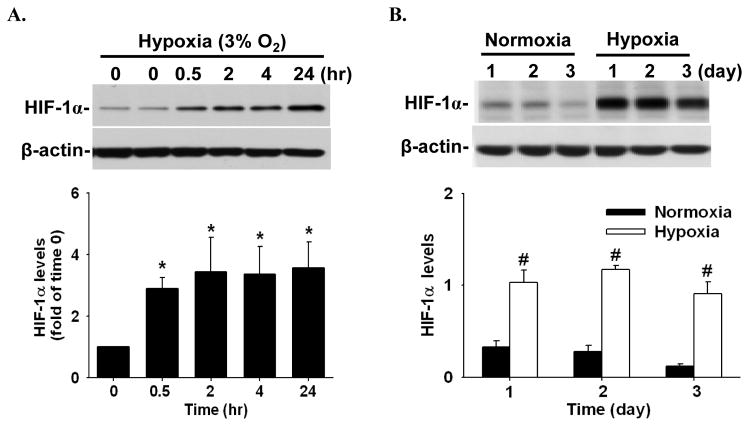
Figure 1.
Hypoxia-increased HIF-1α levels in HPAE cells. Cells were cultured in media containing serum for 24 hr under normoxia, followed by culturing cells under hypoxia in serum containing media (A) or in serum free media (B). Proteins were subjected to Western blot analysis for HIF-1α. Representative images are shown. Data normalized to β-actin are expressed as means ± SEM of fold of the time 0 control (in A; n = 4) or normoxia controls (in B; n = 3). *differ (p < 0.05) from the time 0 control. #differ (p < 0.05) from normoxia on each corresponding day.

