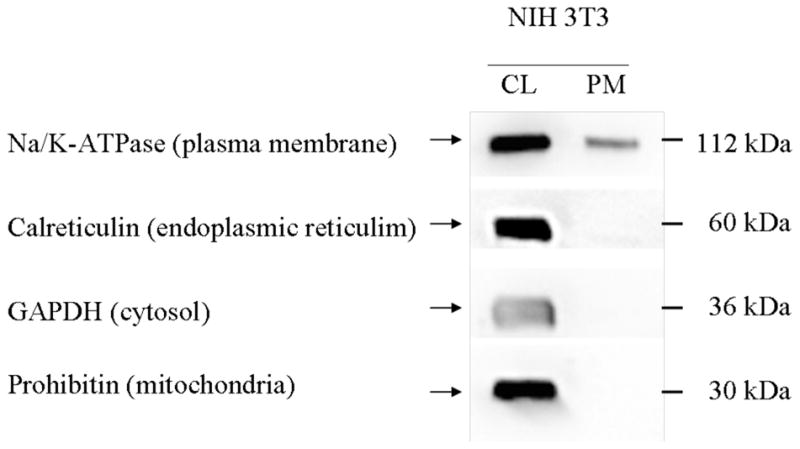
Figure 1.

Distribution of subcellular markers. Cell lysates (CL, 15μg) and plasma membrane enriched fractions (PM, 5μg) were separated by SDS-PAGE on a 10% gel and transferred to a PVDF membrane. Subcellular markers were detected using specific antibodies and an HRP-conjugated secondary antibody. Bands were visualized using Super-Signal West Femto Chemiluminescent Substrate and exposure in the SynGene Gnome. CL, cell lysate, PM, plasma membrane fraction.
