
Figure 4. Flow-cytometric analysis of the proportion of cells expressing the EC marker gene VE-cadherin in response to DNMT inhibition in ESC.
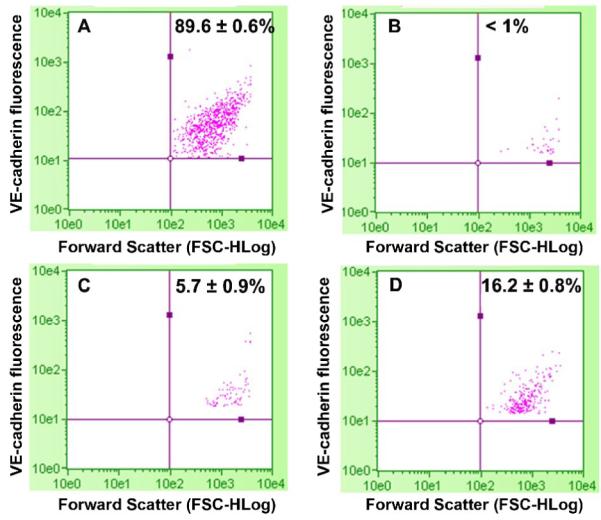
The ESC were exposed to vehicle or 3 μM aza-dC for 24 hours in ESGRO COMPLETE™ basal media lacking LIF. Cultures were returned to basal medium without aza-dC after 24 h of treatment and cells were collected after 11d of treatment for flow cytometry analysis as described in Methods. (A) mBEC, (B) ESC, (C) ESC treated with Vehicle, and (D) ESC treated with 3 μM aza-dC. mBEC were used as positive controls. Values are means (n=3) ± SE). The experiment was repeated three times and representative data is presented.