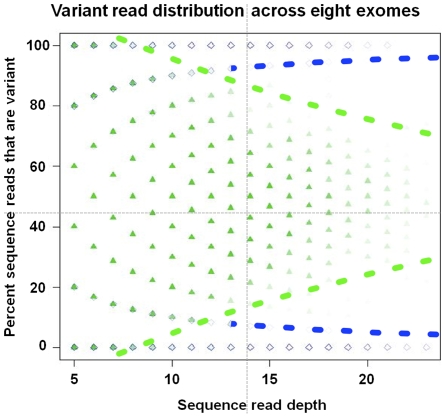
Figure 4. Variant read distribution across eight exomes.
Illustration of the dynamic nature of optimal cut-off rates for calling heterozygous/homozygous variants. At lower coverage (<10x) the ideal cut-off is 88% variant reads in our data, while it is 78% at coverage ≥20. Optimal usage of data should take advantage even of low covered targets. Data are based on comparison to Illumina genotyped SNPs. Green triangles: Illumina heterozygous genotypes, Blue diamonds: Illumina homozygous genotypes. NGS genotypes are placed according to their percent variant reads (y axis).

