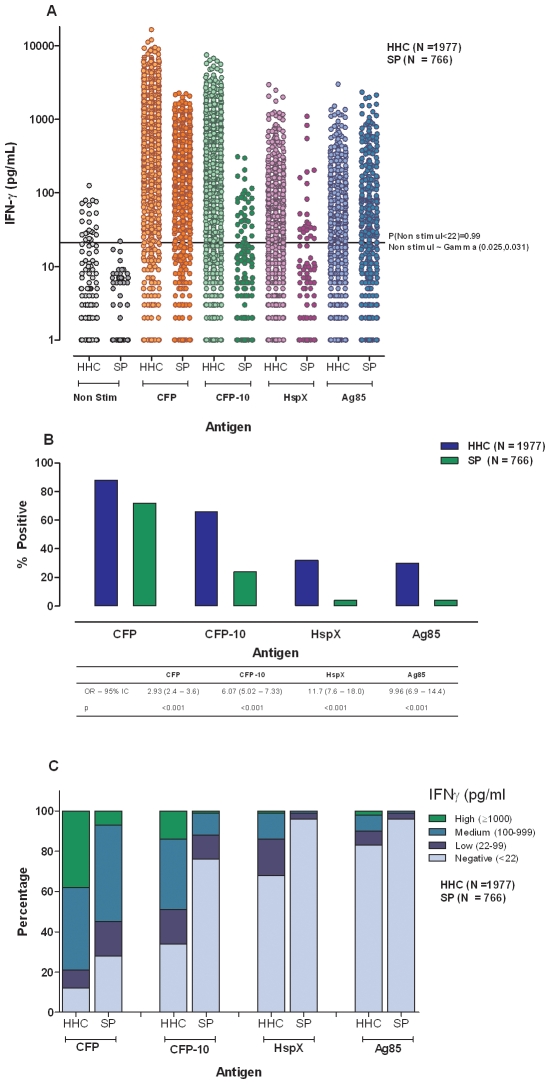
Figure 2. IFNγ production by HHCs and SP.
IFNγ production in whole blood cultures stimulated with four mycobacterial antigens in household contacts and source population. A. IFNγ levels produced in non stimulated and CFP, CFP-10, HspX and Ag85A, stimulated cultures. B. Bar graphs depicting the percentage of positive responders and OR in HHCs and SP. C. Stacked bars represent a modification of the IFNγ production levels proposed by Andersen et al [11] showing: Negative: <22pg/mL, Low: 22–99 pg/mL Medium: 100–999 pg/mL, High: ≥1000 pg/mL. HHCs: Household Contacts; SP: Source Population.

