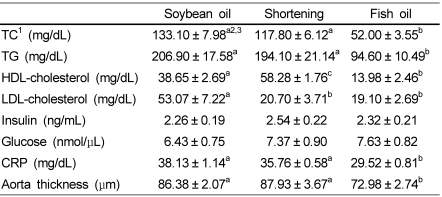
Table 3.
Lipid profile, insulin, glucose, and C-reactive protein
1TC, total cholesterol; TG, triacylglyceride; HDL-cholesterol, high-density lipoprotein-cholesterol; LDL-cholesterol, low-density lipoprotein-cholesterol; CRP, C-reactive protein
2Data were expressed as mean ± SEM of 10 rats per group.
3Values in a row with different letters were significantly different, P<0.01 (ANOVA with post-hoc Tukey's test).

