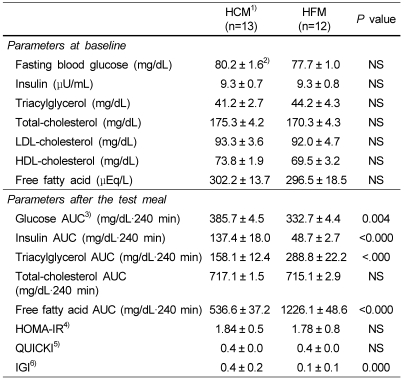
Table 4.
Clinical measurements of the subjects
1)HCM: High carbohydrate meal group and HFM: High fat meal group
2)Values are mean ± SE.
3)AUC : Area under the curve
4)HOMA-IR : glucose (mmol/L) × [insulin (µU/L)/22.5]
5)Quantitative insulin sensitivity check index:1/(log(fasting insulin µU/mL)+ log (fasting glucose mg/dL)]
6)Isulinogenic index: [(30 min insulin - fasting insulin) / 30 min glucose]

