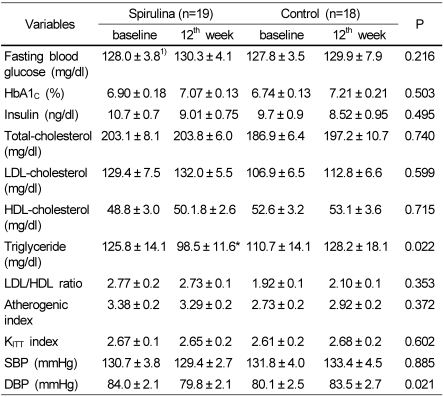
Table 2.
Blood profiles and blood pressure of the subjects during intervention period
1)Mean ± SE
P = Pr>F by repeated measured ANOVA between spirulina and control group after adjusting for sex
Asterisk = Significantly different by paired t-test between baseline and 12th week in the same intervention group, *p<0.05 , HbA1C=Hemoglobin A1C

