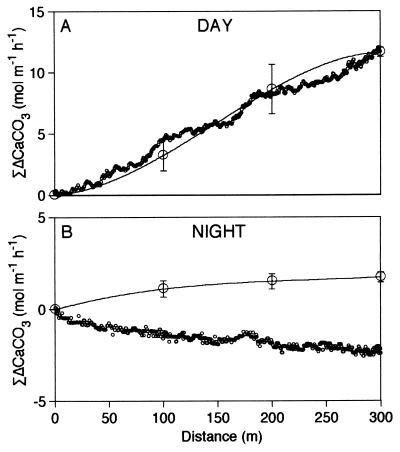
Figure 3.
Estimated cumulative precipitation (positive increments) or dissolution (negative increments) of CaCO3 across the reef flat transect during the middle of the day (mean irradiance = 1811 μmol per m2 per second) (A) and the first part of the night (B). Small symbols indicate estimates based upon pH–O2 measurements assuming PQ = RQ = 1.0; large symbols indicate estimates based upon ΔTA measurements; vertical bars indicate 95% confidence intervals; fitted lines are third-degree polynomials.

