
Figure 8. GODZ-mediated suppression of NR2 surface expression through its palmitoylation on Cys cluster II.
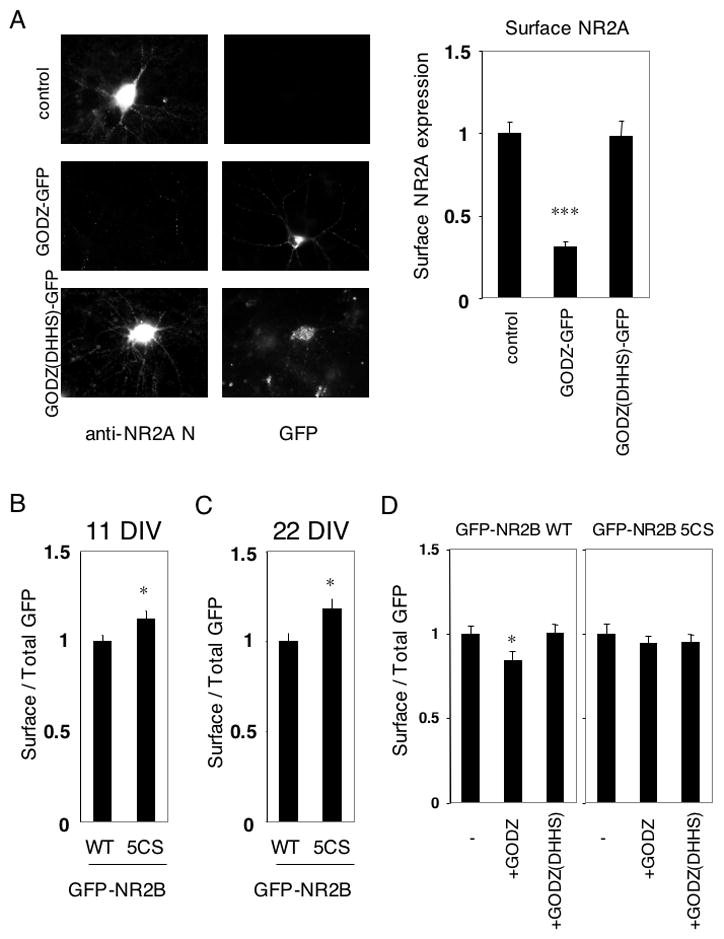
(A) Surface expression of endogenous NR2A in GODZ-GFP transfected cultured cortical neurons. Typical expression patterns of surface NR2A and GODZ-GFP or GODZ(DHHS)-GFP were shown (left). Quantified data of surface expression of endogenous NR2A in transfected cultured cortical neurons at 21 DIV (right, n = 10 neurons respectively, Student t-test. ***p < 0.001 compared with control. (B) Ratio of surface to total GFP expression of GFP-NR2B at 11 DIV (WT and 5CS, n = 16 neurons respectively). (C) Ratio of surface to total GFP expression of GFP-NR2B at 22 DIV (WT and 5CS, n = 16 neurons respectively). Student t-test. *p < 0.05 compared with WT. (D) Effect of myc-GODZ or myc-GODZ(DHHS) inactive mutant on surface expression of GFP-NR2B in transfected cultured cortical neurons at 11 DIV. Ratio of surface to total GFP expression of GFP-NR2B at 11 DIV (WT and 5CS, n = 16 neurons respectively). Student t-test. *p < 0.05 compared with WT. Error bars indicate the sem.