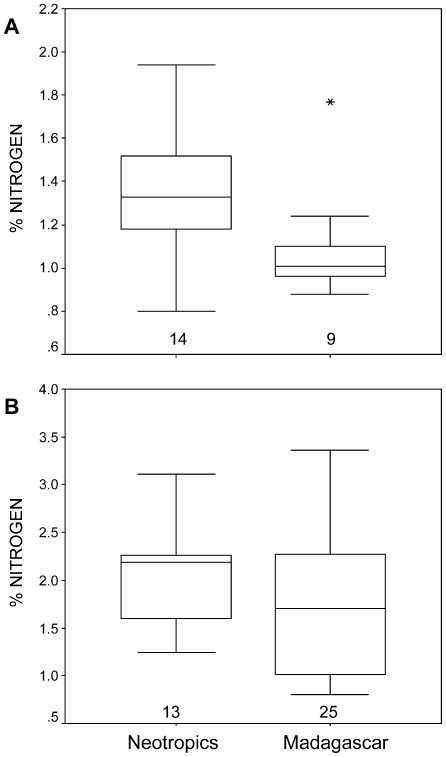
Figure 1. Average nitrogen concentration in fruits and primate vegetable foods in the Neotropics and in Madagascar.
(A) Average nitrogen concentrations in fruits. Number of sites listed along the x-axis (Table 1). (B) Average nitrogen concentrations of all vegetable food items consumed by primates in the Neotropics and in Madagascar. Number of studies listed on the x-axis (Table 3).

