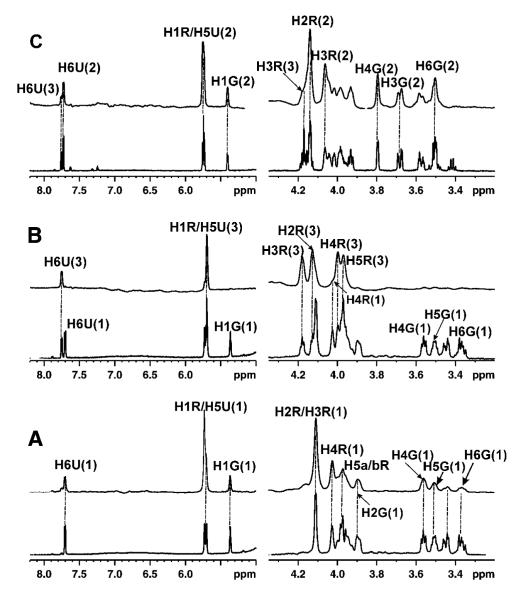
Figure 1.
STD NMR (above) and 1H NMR reference spectra (below) for the binding of ligand at a concentration of 1 mM to 10 μM UGM at 600 MHz and 280 K. (A) UDP-Galf 1 with UGM in the oxidized state; (B) UDP-Galf 1: UDP 3 at a ratio of 1:1 with UGM in the oxidized state showing that the STD signals were mainly from UDP 3 and that the STD signals of UDP-Galf 1 were very weak; (C) UDP-Galf 1 : UDP 3 at a ratio of 1:1 with UGM in the reduced state showing that UDP-Galf 1 has been converted to UDP-Galp 2, and the STD signals were mainly from UDP-Galp 2. The signal assignments for UDP-Galf 1, UDP-Galp 2 and UDP 3 are shown in the top spectrum (U: Uracil; R: Ribose; G: Galactofuranose).

