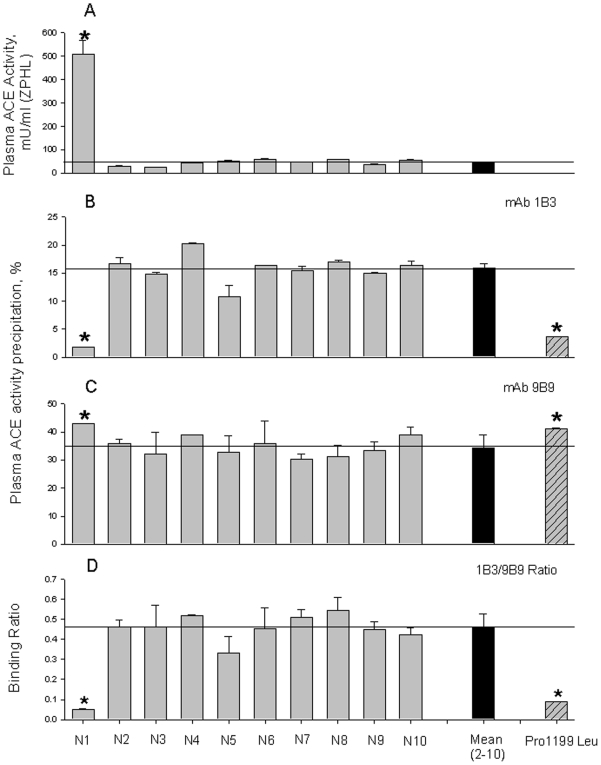
Figure 1. ACE activity and conformation in the heparinized human plasma.
A. ACE activity in 10 samples of heparinized human plasma from healthy volunteers was quantified using a spectrofluorometric assay with Hip-His-Leu (5 mM) and Z-Phe-His-Leu (2 mM) as substrates. Samples were diluted 1/5 (N2-N10) and 1/80 ( N1). Data expressed as mU/ml (with ZPHL as a substrate) of whole plasma. The results are shown as means + SD of several (3–4) experiments. * - p<0.05 in comparison with mean value for samples N2-N10. B–D. Precipitation of ACE activity from plasma samples by mAbs 1B3 and 9B9. Heparinized plasma samples from of 10 volunteers were equilibrated according to 5 mU/ml of the ACE activity with Hip-His-Leu as a substrate and incubated with a wells on the microtiter plate covered by mAbs 1B3 or 9B9 via goat-anti-mouse IgG; then precipitated ACE activity was quantified by fluorimetric assay - plate precipitation assay [36], [39]. Data are expressed as a percentage of ACE activity precipitation by mAb 1B3 (B), mAb 9B9 (C) and as their ratio (D). Data are mean ± SD of triplicates. As a positive control sample of pooled plasma sample from several carriers of Pro1199Leu mutation of ACE [28], was used. * - p<0.05 in comparison with mean value for samples N2-N10.

