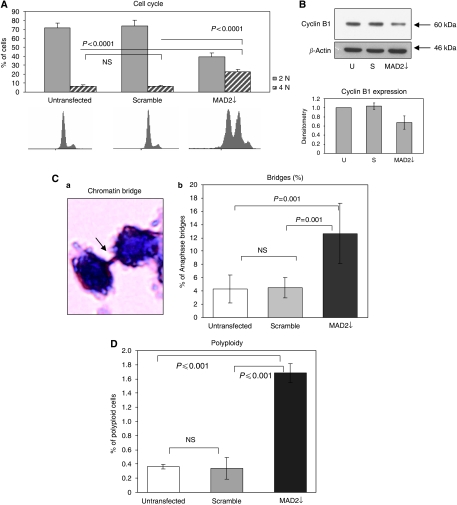
Figure 3.
MAD2 down-regulation alters cell cycle kinetics inducing anaphase bridge formation. (A) Following MAD2 siRNA down-regulation, the cell cycle appeared highly de-regulated, showing less cells with 2N DNA content (P<0.0001) and more in 4N (P<0.0001). (B) Western blotting analysis of cyclin B1 shows a significant decrease of this protein in the MAD2↓ cells compared with the untransfected and scramble controls. (C) Anaphase bridges were visualised using haematoxylin staining, which is a nuclear staining able to highlight only the nuclear content (panel a). MAD2↓ cells demonstrate a three-fold higher percentage of anaphase bridges compared with the untransfected and scrambled controls (P⩽0.001) (panel b). (D) MAD2 down-regulation also results in a higher percentage of polyploid cells (>4N) than the control lines (P⩽0.001). Flow cytometry data were analysed by Summit 4.2 software. Mean values were compared using the t-test assuming equal variances.

