Figure 5.
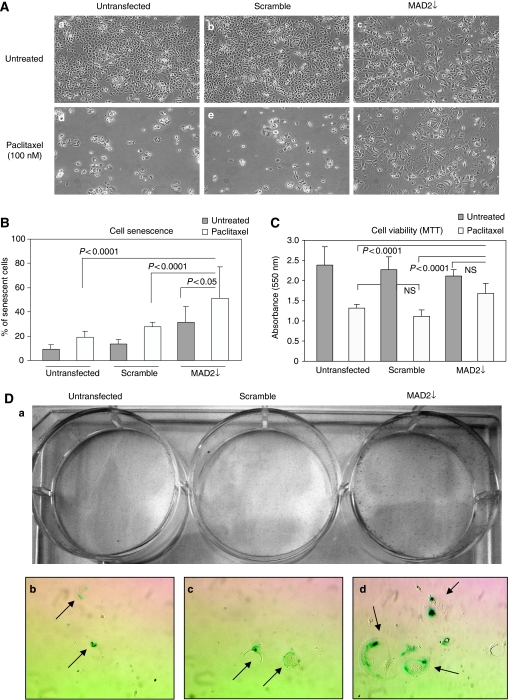
MAD2 down-regulation induces paclitaxel resistance through cellular senescence induction in MCF7 cells. (A) 15 × 104 cells were seeded in each well of a six-well plate. They were either left untransfected or transfected with either MAD2 siRNA or scramble siRNA. Twenty-four hours following transfection, they were either treated with 100 nM of paclitaxel or left untreated. Phase contrast images captured 72 h post paclitaxel treatment showed that MAD2↓ cells remained attached to the flask with many displaying typical senescence morphology (panel f), contrasting dramatically with the untransfected and scramble controls (Panels d and e), which display a rounded shape eventually detaching from the flask. (B) The SA-β-galactosidase staining post paclitaxel treatment shows an increase in cellular senescence in the MAD2↓ cells compared with the untransfected and scramble controls (P<0.0001). Moreover, a significantly higher percentage of senescent cells in the MAD2↓-depleted cells was observed (P<0.05) compared with the MAD2↓ untreated cells. (C) The MTT assay shows a significantly higher (P<0.0001) percentage of viability in the MAD2↓ cells post paclitaxel treatment compared with the untransfected and scramble controls. (D) Post transfection and 100 nM paclitaxel treatment for 72 h, cells were trypsinized and 10 000 cells were seeded in each well and cultured for 10 days. (Panel a) Crystal violet staining showed significantly more viable cells in the MAD2↓ well compared with the untransfected and scramble controls. (Panels b–d) Phase contrast pictures at 10 × magnification show more senescence cells (arrows) in the MAD2↓ well compared with the untransfected and scramble controls.

