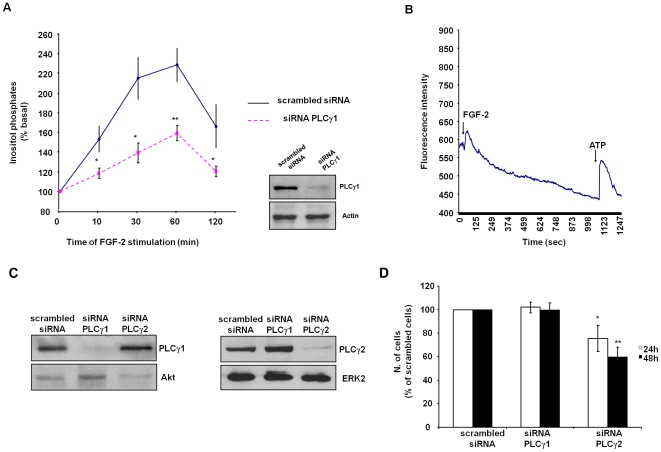
Figure 1. FGF-2 activates PLCγ1 in ECs.
(A) HUVEC were transfected with scrambled siRNA or specific siRNA to downregulate PLCγ1 expression. After 24 h cells were labelled with [3H]myo inositol in M199 containing 2% FBS for a further 24 h and then stimulated with 100 ng/ml FGF-2 for the indicated times. Data indicate the total amount of inositol phosphates generated at the indicated times and are expressed as percentage of the basal inositol phosphates. Data are means±SEM of values obtained from 5 independent experiments. *p<0.05, **p<0.01. Blot shows PLCγ1 expression in lysates of HUVEC transfected with a control scrambled siRNA or siRNA targeting PLCγ1. Equal loading of proteins was assessed by using an anti actin antibody. (B) Intracellular calcium increase in serum starved HUVEC was determined as described in the Materials and Methods session. Cells were stimulated with 100 ng/ml FGF-2 and 1 mM ATP at the indicated times (arrows). Data are mean of values obtained from 4 independent experiments. (C) Expression levels of PLCγ1 or PLCγ2 in HUVEC transfected with the indicated siRNAs. Equal loading was confirmed using anti Akt or anti ERK antibodies. (D) HUVEC were transfected with scrambled siRNA or siRNAs targeting PLCγ1 or PLCγ2. The number of cells was determined by manual counting 24 h or 48 h after transfection. Data are expressed as percentage of cells transfected with scrambled siRNA at each time point and are means±SEM of values obtained from 6 independent experiments. *p<0.05, **p<0.01 vs HUVEC expressing siRNA PLCγ1. In C and D siRNA targeting PLCγ2 were from Dharmacon.

