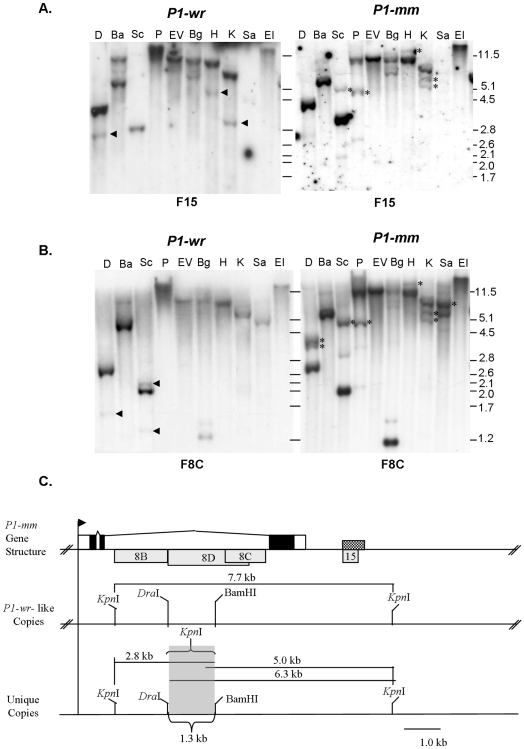
Figure 2. Structural comparison of P1-mosaic and P1-wr [W23].
Gel blots were prepared by digesting seedling leaf DNA with ten diagnostic restriction enzymes. Enzyme shown are: D, DraI; Ba, BamHI; Sc, ScaI; P, PstI; EV, EcoRV, Bg, BglII, H, HindIII; K, KpnI; Sa, SacI; EI, EcoRI. Blots were hybridized with p1 probes corresponding to the distal floral organ enhancer F15 (A) and intron 2 fragment F8C (B). The sizes of molecular weight marker bands are indicated in kilobase pairs to the right of blots. C. The P1-mm gene structure diagram is based upon the published sequence of P1-wr [W23] (Accession EF165349). The positions of exons are shown as rectangles and introns are represented by the connecting lines. The shaded regions of the rectangles represent coding sequence, whereas the unshaded regions represent the UTRs. The arrow represents the transcription start site. The hash marks indicate the positions of linked copies in the tandem gene array. The checkered box shows the position of the p1 distal enhancer, which is present in every gene copy. p1 probe fragments are indicated below the gene structure diagram as grey rectangles. Shown below the map of P1-wr are gene copies of P1-mm that are structurally similar (top) and unique (bottom) from P1-wr. The grey shaded box indicates the region of these copies that is shown to be structurally unique. The sizes of KpnI fragments are given in kilobase pairs.

