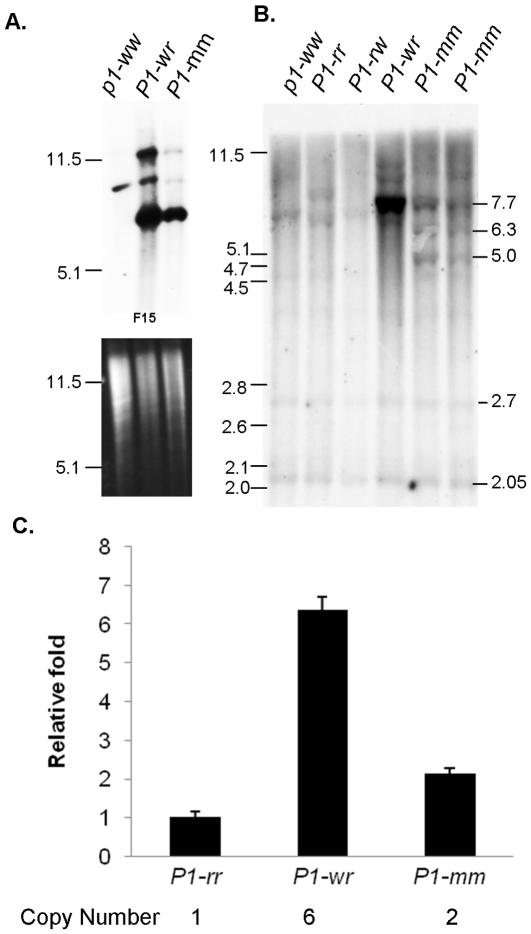
Figure 3. DNA gel blot analysis showing the copy number and structure of P1-mm.
A. The copy number was inferred from BamHI digested DNA gel blots hybridized with the p1 distal floral organ enhancer fragment F15. The ethidium bromide stained gel indicates the relative DNA loading. Lanes are shown with names of alleles. B. Copy number was inferred from KpnI digested DNA gel blots hybridized with intron 2 probe fragment F8C. Molecular weight marker band sizes are shown to the left of the blots. The sizes of bands discussed in the text are indicated in kilobase pairs to the right of the blot. C. Real-time quantitative PCR was performed to estimate the copy number using P1-rr-4B2 as reference genotype (single copy). The relative fold is calculated using P1-rr-4B2 as a reference. Vertical lines indicate standard error (n = 3).

