
Figure 3.
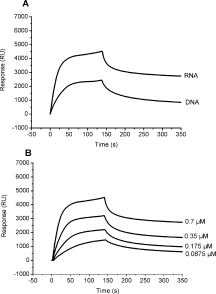
(A) Binding capacity sensorgrams of HCoV-OC43 N protein (0.7 μM) bound to single-stranded RNA or single-stranded DNA. The RNA and DNA sequences immobilized on the SA chip were 5′-(UCUAAAC)4-3′ and 5′-(TCTAAAC)4-3′, respectively. (B) Sensorgrams of HCoV-OC43 N protein bound to single-stranded RNA. HCoV-OC43 N protein was exposed to RNA at concentration of 0.7, 0.35, 0.175, and 0.0875 μM. The buffer consisted of 50 mM Tris-HCl (pH 7.3) containing 150 mM NaCl and 0.1% CHAPS. The association rate increased with an increasing concentration of target N protein and the dissociation rate was independent of concentration. The fitted data was shown in Supporting Information (Figure S3).