
Figure 6.
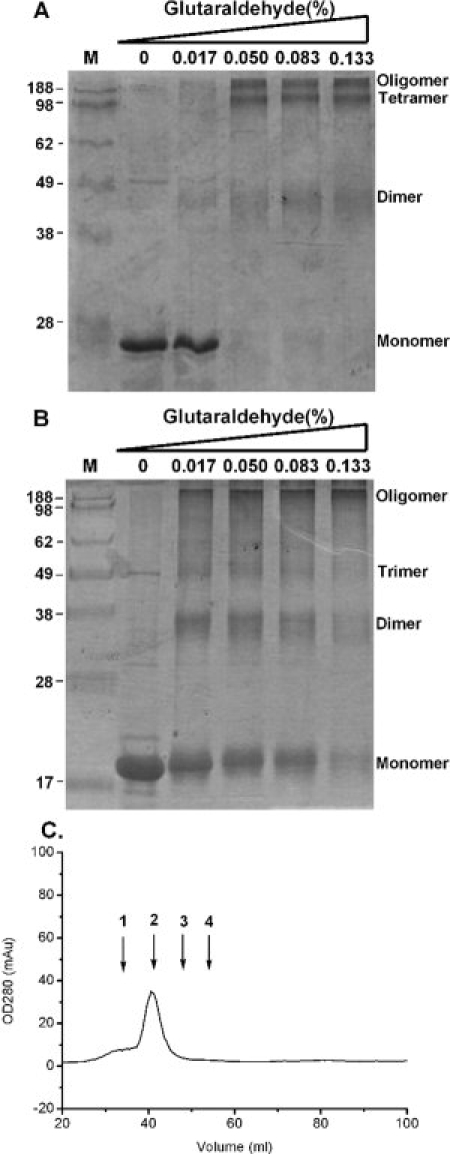
(A) Crosslinking assay of N233–448 in the presence of glutaraldehyde at various concentrations. The concentration of target protein was 2 μM. (B) Crosslinking assay of N301–448 in the presence of the indicated concentrations of glutaraldehyde. The concentration of target protein was 3 μM. (C) Gel filtration chromatography based analysis (Superdex 200 XK16/70) of N301–448 buffered by 50 mM Tris-HCl with 150 mM NaCl and 0.1% CHAPS at pH 7.3. The concentration of target protein was 5 μM. The protein markers of 669 kDa, 223 kDa, 67 kDa, and 43 kDa are denoted as 1, 2, 3, and 4, respectively.