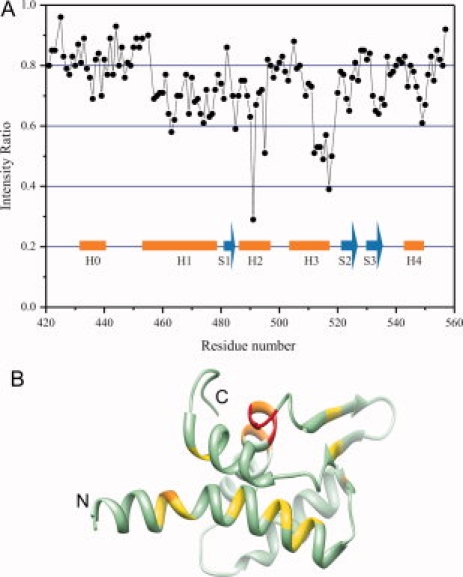
Figure 5.

Plots of the intensity ratios of the peaks in the transferred cross-saturation experiments. (A) The intensity ratios of the peaks originating from the backbone amide groups with irradiation to those without irradiation measured in 10% H2O/90% D2O. Residues near Cys491 and Cys498 in helix H2 were not accounted due to the possible artifact from the irradiation of γ protons of the cysteine residues. The saturation time used was 3 s. (B) A ribbon diagram of mCdt1C which are colored based on the cross saturation experiment. Residues of the H1 and H3 helices with the best signal are colored with orange and the residues with the second best signal are colored with yellow.
