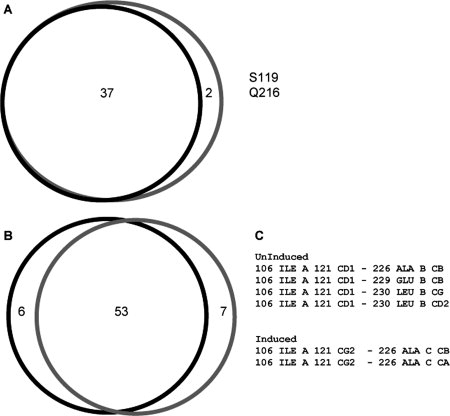
Figure 2.

Comparison of the contact profiles generated from QContacts. Panel A shows the residues found in both contact profiles of the regulatory domains of the uninduced and induced crystal forms of CynR. B: The shared contacts between the uninduced and induced crystal forms of CynR. C: The atomic interactions of I106 contacting A226, E229, and L230 in the uninduced and induced crystal forms of CynR. Black lines, uninduced form. Gray lines, induced form.
