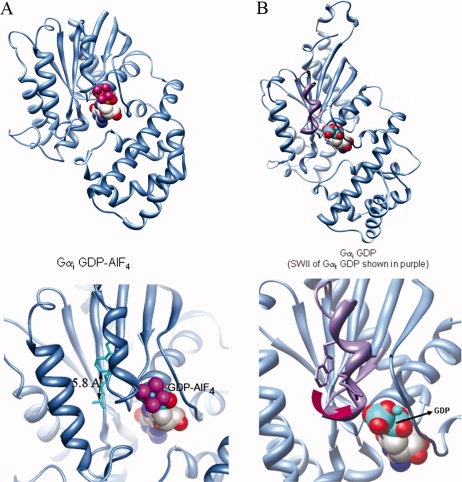
Figure 6.

Model. (A) Crystal structures of activated Gαi (PDB file 1GFI, top panel, overview; bottom panel, Switch II region enlarged, nucleotide shown in spacefill) demonstrate that the Trp π electrons are within 6 Å from the positively charged Arg in the Switch II helix. (B) Ordered regions of GαiGDP (PDB file 1BOF) shown in blue, Switch II region of GαtGDP in purple (from structural alignment of PDB file 1TAG and 1BOF), and nucleotide shown in spacefill. Top, overview; bottom panel, enlarged, depicting spatial separation of 8 Å or more between the Switch II Arg and Trp after GTP hydrolysis has occurred.
