
Figure 3.
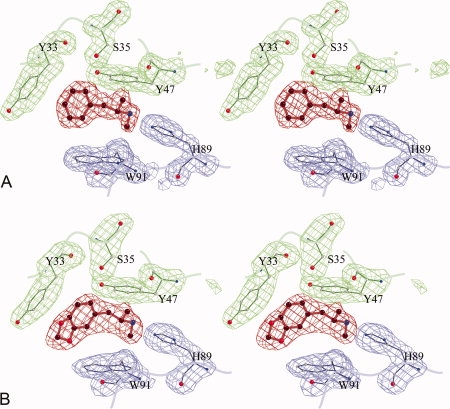
The omit maps displaying the electron densities of the ligands and surrounding amino acids. The ligands are shown in red, the heavy chain residues in green, and the light chain in blue. (A) METH and surrounding five residues. The map is computed at 1.9 Å resolution and the contours are drawn at 2.7σ level (B) MDMA and surrounding residues. The map is computed at 2.4 Å and the contours are drawn at 2.7σ level.