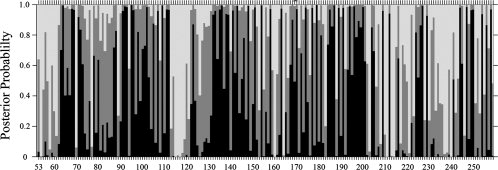
Figure 1.

Selection pressure as measured by ω-ratio of nonsynonymous versus synonymous codon substitution rates at each amino acid residue of the N-terminal domain of GABAC receptor (residues 53–259). The x-axis shows the residue numbers of the protein. The y-axis shows the posterior probabilities of ω belonging to one of the three classes, where all probabilities sum up to unity at each residue position. The ω-ratios are grouped as follows: ω1 ≤ 0.0078 (darkly shaded vertical segment), 0.0078 < ω2 ≤ 0.026 (gray segment), and ω3 ≥ 0.0258 (light segment). Residues with large probability for ω1 (dark) are experiencing strong purifying selection and are highly conserved.
