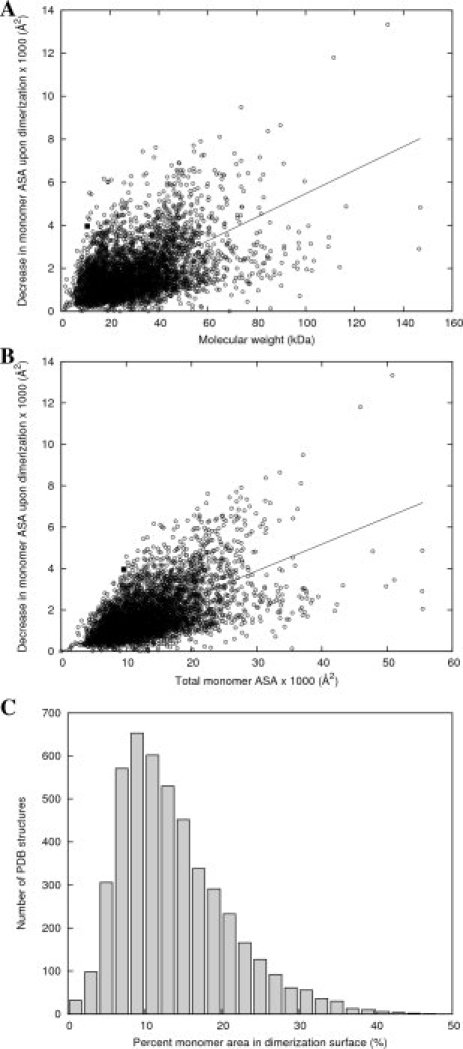
Figure 3.

Correlation of the area of the dimerization surface as a function of molecular weight or total surface area for a nonredundant set of 4710 proteins predicted to form homodimers by the Protein Quaternary Server. (A) Area of the dimerization interface surface for each homodimer, plotted as a function of the molecular weight of one monomer. The solid line is the linear least-squares regression fit, and AF2331 is shown as a filled square. (B) Area of the dimerization interface surface for each homodimer, plotted as a function of the total ASA for one monomer. The solid line is the linear least-squares regression fit, and AF2331 is shown as a filled square. (C) Histogram of percentages of monomer ASA in the interface surface for the nonredundant set of homodimers. 41.1% of the total surface area of a monomer of AF2331 is contained within its dimerization surface.
