Figure 3.

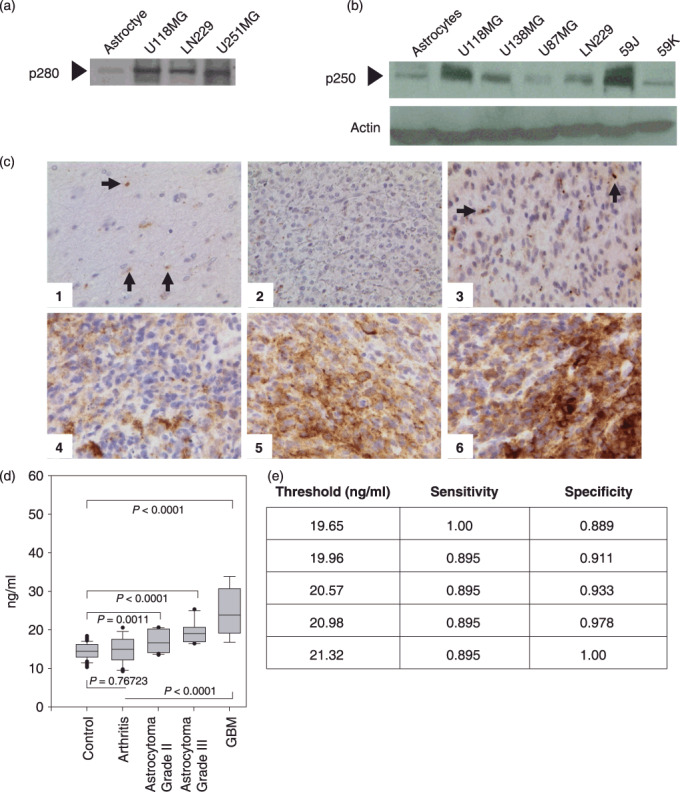
Evaluation of filamin‐A levels in human brain cell lines, brain tissue, and plasma samples. Alper p280 was used to western blot conditioned culture media of the indicated cell lines (a). Alper‐p280 was used to evaluate cellular filamin‐A (p250) levels from the indicated whole cell extracts. Actin western blot analysis was done as a control for equal loading (b). Immunohistochemical analysis on formalin‐fixed paraffin‐embedded sections of representative brain lesions using Alper‐p280 antibody against filamin‐A. Negative staining in normal brain tissue (1) and World Health Organization grade 2 oligodendroglioma (2); 2+ cytoplasmic (subcellular) staining in occasional neoplastic cells in grade 2 astrocytoma (3) and 3+ cytoplasmic (subcellular) staining in neoplastic cells in grade IV glioblastoma multiforme (4), (5), and (6). Magnification, ×400. Arrows, filamin‐A (c). Box plot analysis representing levels of the 280‐kDa form of filamin‐A in plasma detected by the Alper‐p280 antibody and measured by ELISA in plasma. Soluble filamin‐A levels were determined by ELISA from plasma samples obtained from normal controls, patients with arthritis, astrocytomas, or glioblastoma (GBM). Soluble filamin‐A plasma concentrations were determined by generating a standard curve using normal human plasma spiked with known amounts of recombinant human filamin‐A. P‐values were determined by comparison with controls by anova. Data are representative of four independent experiments performed in triplicate. All analyses were done under blinded conditions (d). Threshold Chart (e).
