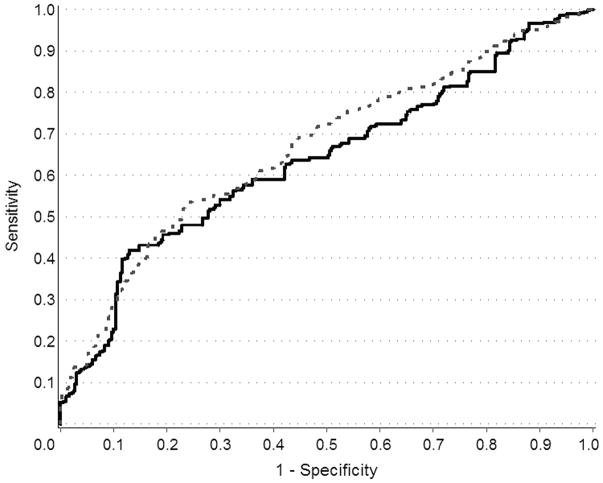
Figure 1.
ROC curves for the effect of five SNPs in the 8q24, 17q12, and 17q243 chromosomal regions in predicting risk of prostate cancer. Solid line indicates curve fit with clinical variables only (i.e., age, serum PSA level at diagnosis or interview, first-degree family history of prostate cancer) and dashed line indicates curve fit with clinical variables plus the five SNPs.

