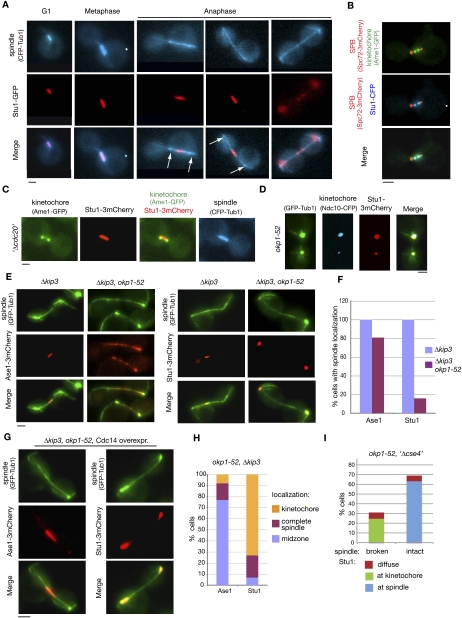
Figure 2.
okp1-52 KTs fail to release Stu1. (A–C) Stu1 localization in wild-type cells. Bar, 2 μm. (A) Stu1 and spindle were visualized at the indicated cell cycle phases. Arrows indicate the position of KTs. (B) Stu1 localizes at the KT early in mitosis. Cells were analyzed 80 min after the release from G1. The phenotype shown was observed in 24% of the cells. n > 100. (C) Stu1 localizes to the spindle in metaphase. GAL-CDC20 cells were arrested in metaphase by Cdc20 depletion. (D) Stu1 remains at okp1-52 KTs during spindle pole separation. Cells were analyzed 120 min after the release from G1 at 37°C. Bar, 2 μm. (E) In okp1-52 cells, Stu1, in contrast to Ase1, fails to locate to ipMTs stabilized by KIP3 deletion. Δkip3 cells were analyzed 150 min after the release from G1 at 37°C. Bar, 2 μm. (F) Quantification of Ase1 and Stu1 localization as observed in E. n > 100. (G) In okp1-52 cells, Stu1, in contrast to Ase1, does not localize to the midzone of Δkip3-stabilized ipMTs upon overexpression of Cdc14. Cells were released from G1 at 25°C in raffinose, the temperature was shifted to 37°C, Cdc14 overexpression was induced (2% galactose) 90 min after the release, and spindles were analyzed 210 min after the release. Bar, 2 μm. (H) Quantification of Ase1 and Stu1 localization as observed in G. n > 100. (I) Compromising okp1-52 KTs by Cse4 depletion rescues spindle formation. GAL-CSE4 cells were depleted of Cse4 during a G1 arrest. One-hundred-twenty minutes after the release at 37°C, spindle phenotypes (GFP -Tub1) and Stu1-3mCherry localization were quantified.

