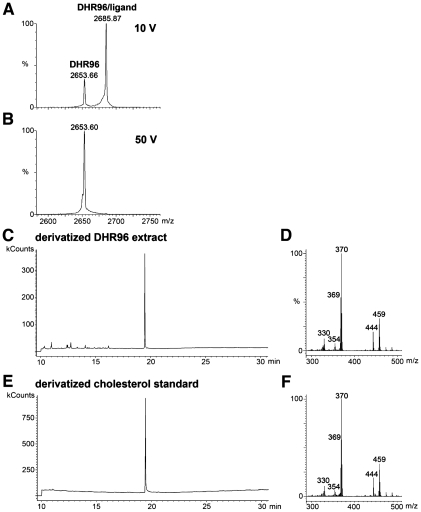
Figure 1.
Mass spectrometry identifies cholesterol bound to the DHR96 LBD. (A) CID mass spectrum of the DHR96/cholesterol complex under nondenaturing conditions with a collision voltage of 10 V. At this voltage, a portion of the ions representing the 12+ charge state of the DHR96/ligand complex (2685.87 m/z) fragment to generate ions of the 12+ charge state of DHR96 (2653.66 m/z), losing the ligand as a free molecule. The charge states of the ions at 2685.87 and 2653.66 m/z were determined from full-range MS scan spectra (data not shown). (B) CID mass spectrum of the DHR96/ligand complex with a collision voltage of 50 V caused complete dissociation of the receptor/ligand complex into unbound receptor. (C–F) The elution time of the major peak on a gas chromatogram of a derivatized chloroform–methanol extraction of the DHR96 LBD (C) matches that of a derivatived cholesterol standard (E). The corresponding electron ionization spectrum from the major peak of the DHR96 LBD at 19 min generates major fragmentation ions (D) that correspond closely to the major fragmentation ions generated from the major peak of the derivatived cholesterol standard (F).

