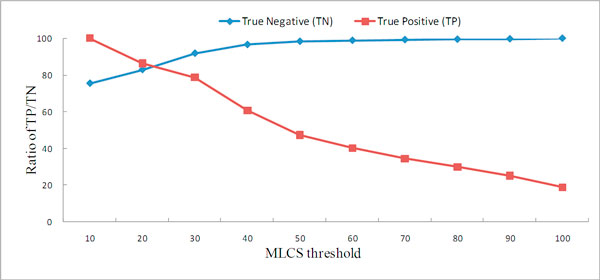
Figure 6.
MLCS analysis. A true positive represents a multi-localized protein whose MLCS is above the threshold and a true negative represents a single-localized protein whose MLCS is below the threshold. We compare the ratio of true positives/true negatives to the total number of multi-/single-localized proteins.

