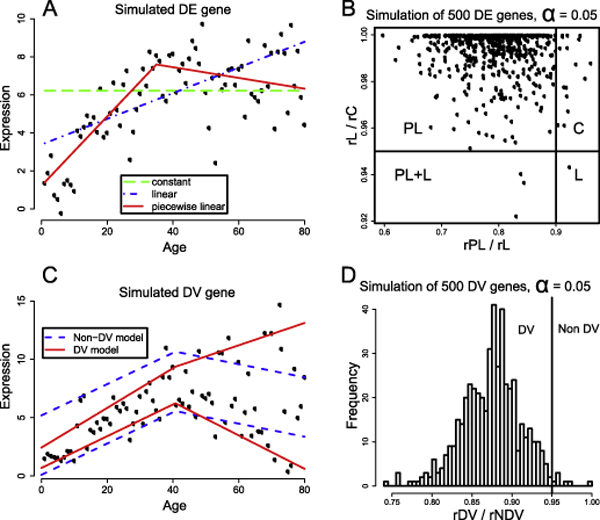
Figure 1.
Illustration of our model selection approach to identifying both age-dependent DE and DV patterns. The four plots in this figure illustrate the core idea of our model selection approach to identifying genes with age-dependent change in expression (DE) or variability (DV). (A) A gene with an artificially simulated expression profile is fitted with three quantile regression models: the constant model, the linear model and the piecewise linear model. The estimated quantile regression lines are superimposed onto the expression profile. The simplest model that fits the data reasonably well is selected to be the target model. If the linear model or piecewise linear model is selected, this gene is said to be DE. (B) The distribution of rPL/rL and rL/rC of 500 artificially simulated genes with non-linear age-dependent expression changes. Given a predefined threshold, a, all genes are partitioned into one of four groups (C, L, PL, and PL+L), based on where they are located in this plot. (C) This plot shows the expression profile of a gene that has been simulated to have increasing variability with ageing. Both a non-DV and a DV quantile regression models are fitted to the data of this gene, and the fitting regression quantile lines are superimposed onto the plot of the expression profile. (D) A histogram showing the distribution of the rDV/rNDV value generated by fitting the non-DV and DV models to 500 simulated genes with DV. Most of the genes have a rDV/rNDV value less than the (1 - α) threshold, and are therefore correctly identified as DV.

