Figure 6.

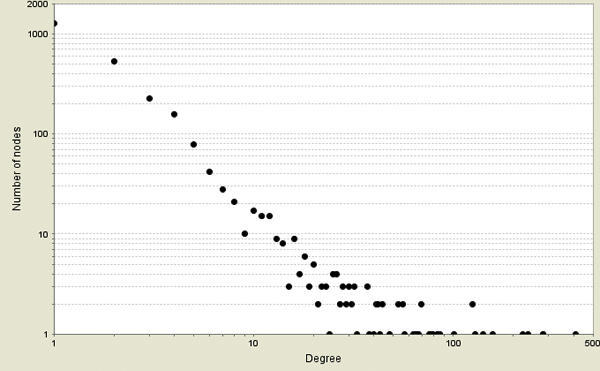
Plot of node degree distribution. The figure illustrates the node degree distribution for the aging network constructed.

Plot of node degree distribution. The figure illustrates the node degree distribution for the aging network constructed.