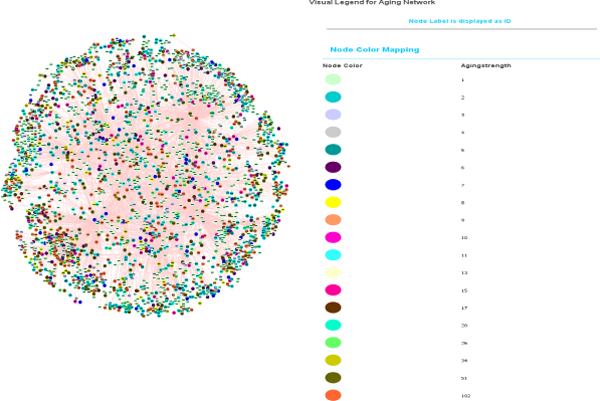
Figure 7.
'Aging network' visualized using Cytoscape. The graphical view of the 'aging network' where proteins are denoted using nodes and interactions are denoted using edges. The nodes are colored based on the strength centrality measure. Cytoscape http://www.cytoscape.org/ was used for network visualization.

