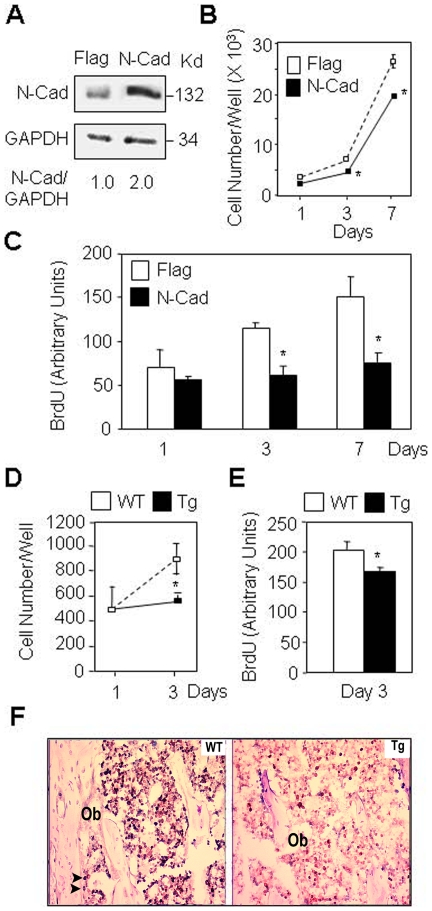
Figure 1. Enforced expression of N-cadherin decreases cell proliferation in osteoblasts.
(A) MC3T3-E1 osteoblasts stably transfected with N-cadherin (N-Cad) display a 2-fold increase in N-cadherin expression compared to control cells (Flag) as shown by western blot analysis. (B, C) Decreased cell number and replication in N-Cad cells compared to Flag cells. (D, E) Decreased cell number and replication in primary calvarial osteoblasts isolated from N-cadherin transgenic mice (Tg) compared to osteoblasts from wild-type mice (WT). Means are +/− SD. Values that are significantly different are indicated (*, P<0.05 vs Flag or WT cells). (F) Histologial sections of tibias showing decreased cell proliferation in N-Cad Tg mice compared to WT mice, as revealed by Ki67 staining (black nuclei) in bone marrow stromal cells and mature osteoblasts (Ob, arrows) (x250).

