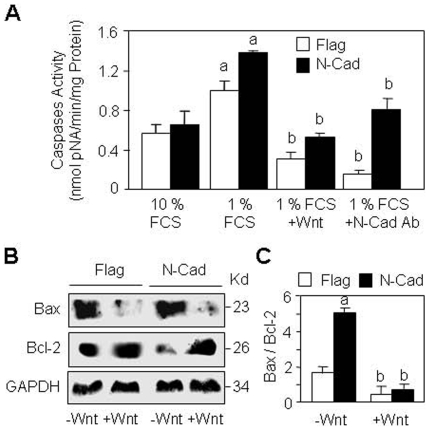
Figure 7. Mechanisms by which N-cadherin decreases cell survival.
(A) Control (Flag) and N-Cadherin overexpressing cells (N-Cad) were cultured in survival conditions (10% FCS) or serum deprived (1% FCS) medium, treated with Wnt3a (15% CM), blocking N-cadherin antibody or control antibody (IgG) for 24 hours and effector caspase activity was determined. Means are +/− SD (a, P<0.05 vs corresponding 10% FCS; b, P<0.05 vs corresponding untreated cells. (B) Flag and N-Cad cells were cultured in serum deprived (1% FCS) medium, treated with Wnt3a (15% CM) for 24 hours, and the levels of Bax and Bcl-2 proteins were analysed by Western blot using GAPDH as loading control. (C) Quantification of western blots showing the increased Bax/Bcl-2 ratio in N-Cad cells which was abolished by Wnt3a (a, P<0.05 vs untreated Flag cells; b, P<0.05 vs corresponding untreated cells).

