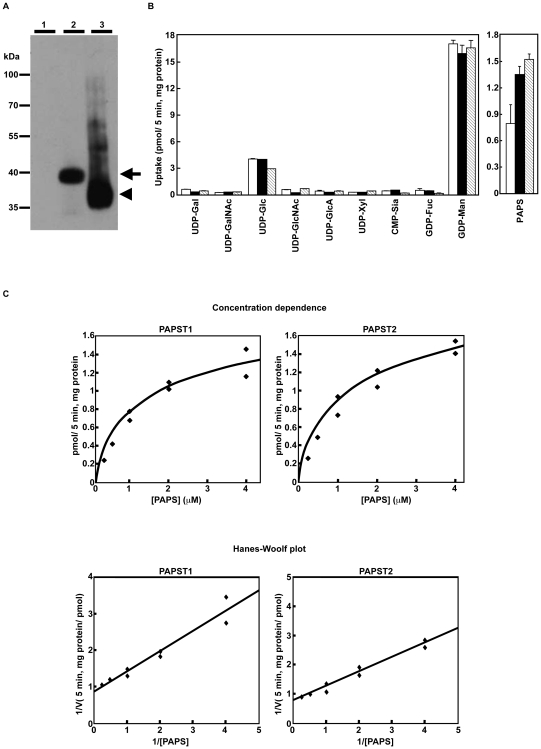
Figure 1. Both mouse PAPST1 and PAPST2 encode PAPS transporter proteins.
(A) Expression state of PAPST1 and PAPST2 proteins in the Golgi-enriched fraction. Western blot analysis of the P100 fractions prepared from yeast cells expressing either the mock vector (lane 1), HA-tagged PAPST1 (lane 2) or HA-tagged PAPST2 (lane 3). An aliquot of 5 µg of protein from the control cells and cells expressing HA-tagged PAPST1 or 0.5 µg of protein from the cells expressing HA-tagged PAPST2 was loaded. The arrow and arrowhead indicate HA-tagged PAPST1 and HA-tagged PAPST2, respectively. (B) Substrate specificity of PAPST1 and PAPST2. Each P100 fraction was incubated in 50 µl of reaction buffer containing 1 µM labelled substrate at 32°C for 5 min, and the radioactivity incorporated was measured. The indicated values are the mean±SD obtained from two independent experiments (open bars, Mock; solid bars, PAPST1; hatched bars, PAPST2). (C) Substrate concentration dependence. Each P100 fraction was incubated in 50 µl of reaction buffer containing different concentrations of [35S]PAPS at 32°C for 5 min, and the radioactivity incorporated was measured. Specific incorporation was calculated by subtracting the value for the mock transfection from each of the values obtained. Lower panel, the Hanes-Woolf plot used to determine the Km value is shown.

