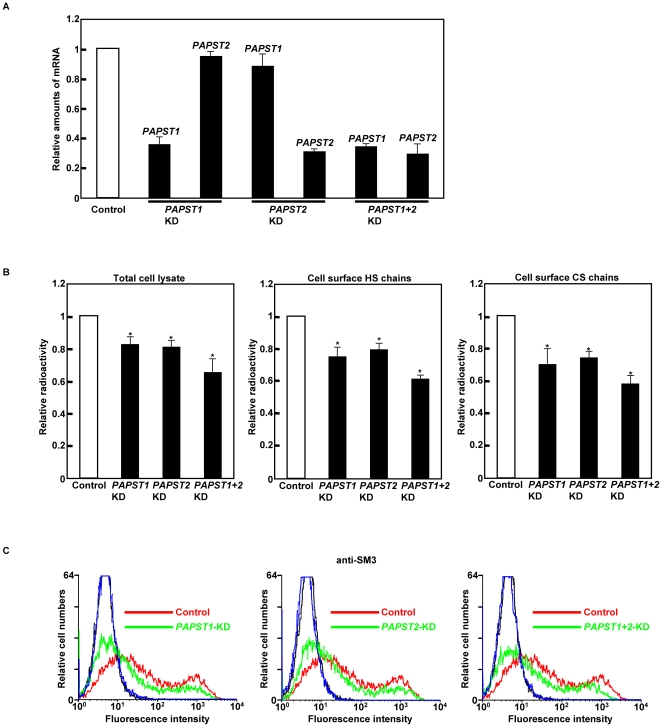
Figure 2. Knockdown of PAPST1 or PAPST2 mRNA induced reduction of sulfation in mESCs.
(A) Real time PCR analysis of cells 2 days after transfection. Relative amounts of PAPST mRNA were calculated after normalization to β-actin mRNA in the same cDNA. The results are shown after normalization against the values obtained with control cells (value = 1). The values shown are the means±SD of three independent experiments. (B) Metabolic labeling analysis. The results of total sulfate incorporation into cellular proteins and sulfate incorporation into cell surface HS and CS chains are shown after normalization against the values obtained with control cells (value = 1). The values shown are the means±SD of three independent experiments and significant values are indicated; *P<0.01, in comparison to the control. (C) FACS analysis of cells 3 days after transfection using an anti-SM3 antibody (black and blue lines represent the IgM isotype control for control and PAPST-KD cells, respectively). Three independent experiments were performed and representative results are shown.

