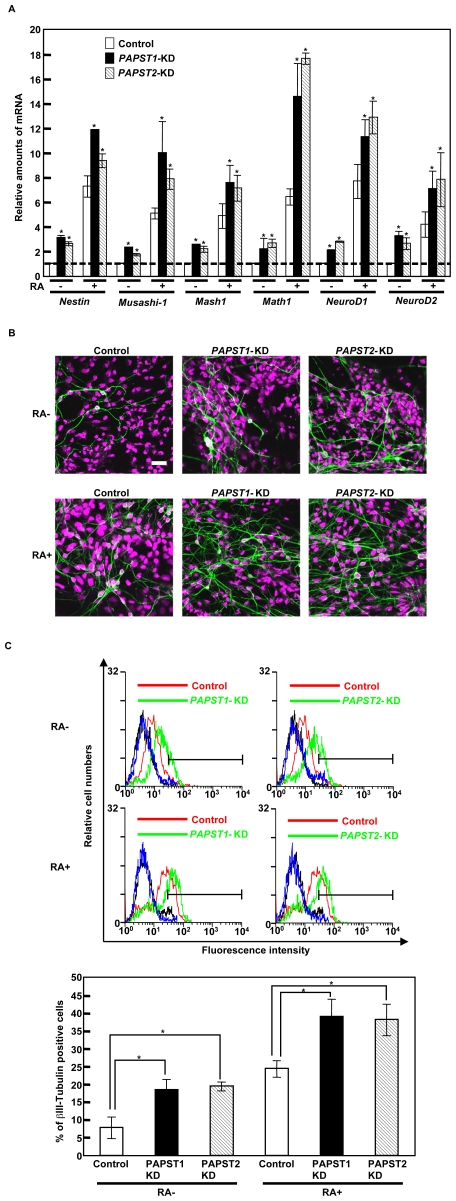
Figure 6. Neurogenesis was promoted in PAPST-KD cells.
(A) Real time PCR analysis of neural differentiation markers 8 days after EB formation. The results are shown after normalization against the values obtained with control cells not treated with RA (value = 1). The values shown are the means±SD of duplicate measurements from two independent experiments and significant values are indicated; *P<0.05, in comparison to the control. (B) Immunocytochemical staining 6 days after replating of EBs. Representative confocal images from two independent experiments are shown. (βIII-Tubulin, green; PI, purple). Scale bar, 20 µm. (C) FACS analysis 6 days after replating of EBs using an anti-βIII-Tubulin antibody (black and blue lines represent the IgM isotype control for control and PAPST-KD cells, respectively). Three independent experiments were performed and representative results are shown. The histograms show the ratio of the mean fluorescent intensity within area of the insetted bar representing βIII-Tubulin positive cells to the mean fluorescent intensity over the total area±SD of three independent experiments and significant values are indicated; *P<0.01, in comparison to the control.

