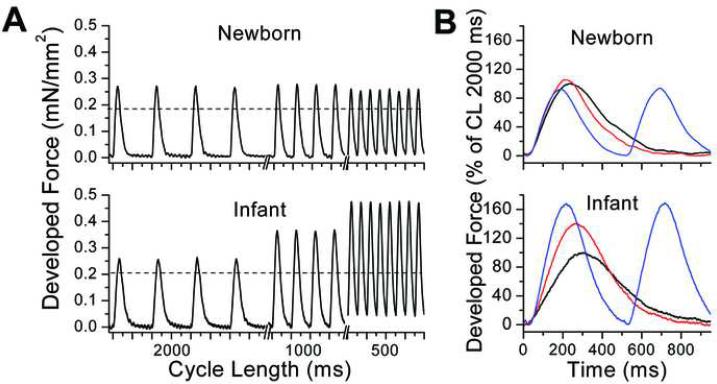
Figure 1.
Contractions measured in ventricular tissue strips. A. Developed force from a newborn (4 days old, top panel) and an infant (3 months old, bottom panel) strip. The pacing cycle length (CL) decreased from 2000 to 1000 and 500 ms. Steady state contractions are shown and the dashed line indicates the amplitude of developed force at CL 2000 ms. B. Developed force as in A, but normalized to the amplitude at CL 2000 ms (black line) with CL 1000 ms (red) and CL 500 ms (blue) overlaid.

