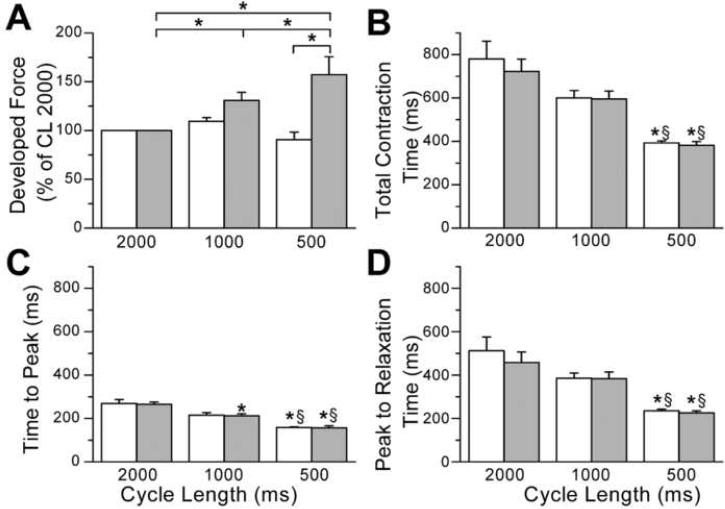
Figure 2.
Average data for contractions from newborn and infant ventricular tissue strips are shown. A. Average developed force expressed as percent of CL 2000 ms for newborn (open, n=7, 4 patients) and infant (shaded, n=7, 6 patients) ventricle (*p<0.05). B. Total contraction time, C. Time to peak and D. Peak to 90% relaxation time for newborn (open) and infant (shaded) ventricular strips (*, p<0.05 compared to CL 2000 ms, §, p<0.05 compared to CL 1000 ms).

