
Figure 2. Modulation of ceramide species by GMZ.
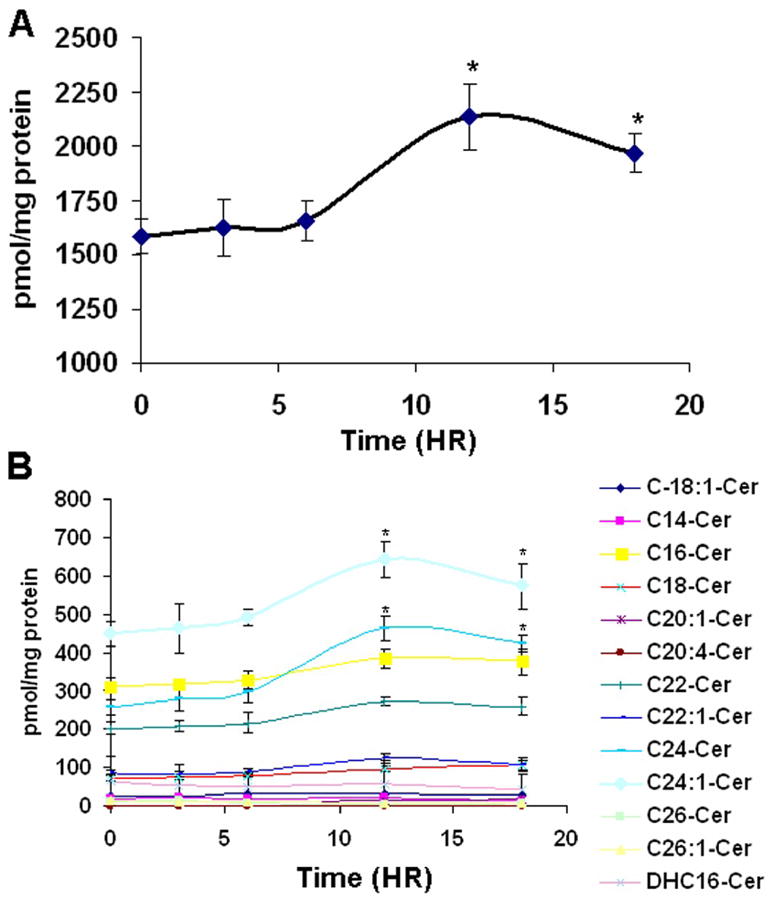
H. end. cells were seeded in 100 mm dishes and treated with 0.6 μM GMZ. Cells were collected at 3, 6, 12, and 18 hours after treatment, and sphingolipids were extracted. Ceramide species were analyzed by mass spectroscopy and each sample was normalized to its respective total protein levels. (A) Total ceramide. (B) Ceramide species. The values are expressed as the mean ±SD (n=3). The results are representative of two independent experiments. *Significant differences in comparison GMZ treatment to control (P<0.05).