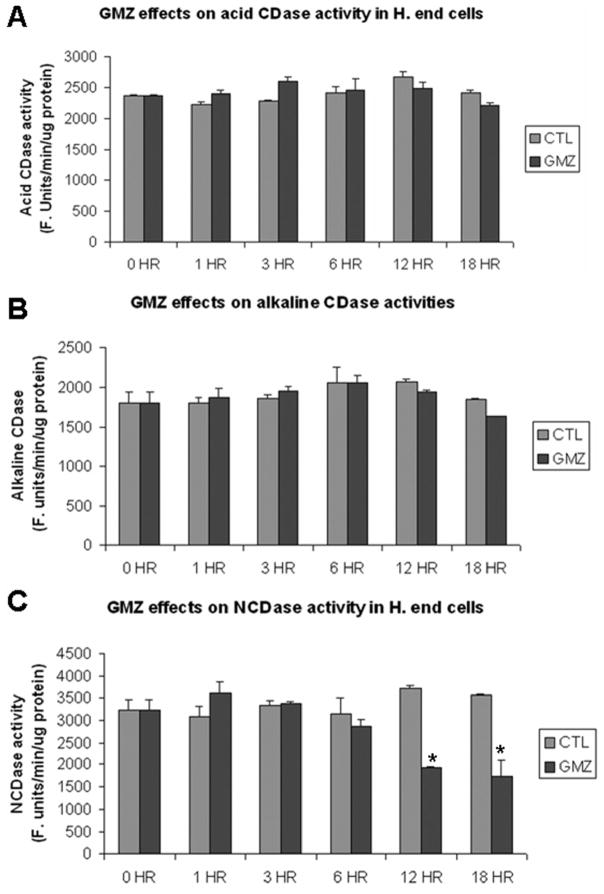
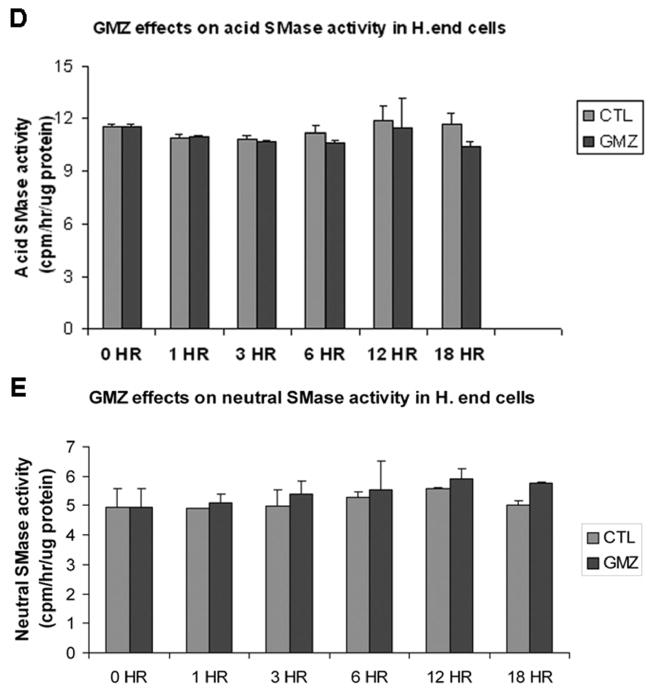
Figure 3. GMZ effects on sphingomyelinase and ceramidase activities.
H. end. cells were treated with 0.6 μM GMZ for various time points (0, 1, 3, 6, 12 and 18 hours). The cells were lysed and subjected to assays of SMase and ceramidase activities. (A) acid CDase activities. (B) Alkaline CDase activities. (C) NCDase activities. (D) Acid SMase activities. (E) Neutral SMase activities. The values are expressed as the mean ±SD (n=3). The results are representative of at least two independent experiments. *Significant differences in comparison GMZ treatment to control (P<0.05).


