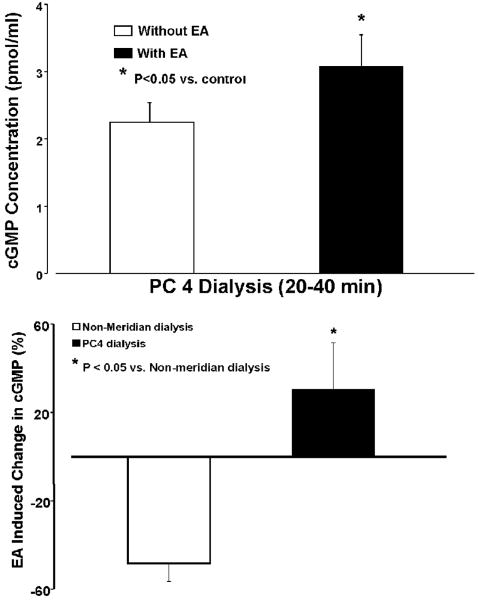
Figure 5.
Effect of EA PC3 on dialysate PC 4 cGMP concentration (top) and percentage change in cGMP at PC 4 dialysis and dialysate from its non-meridian area following EA PC 3. Top panels show that PC 4 dialysate cGMP concentrations (pmol/ml) were significantly increased 20 min after EA PC 3 compared to the same period of dialysis without EA stimulation. Bottom panels show percentage change in cGMP 20 min after EA PC 3 at PC 4 and non-meridian area dialysis compared to PC 4 dialysis without EA. The mean basal level of cGMP in the second collection of PC 4 dialysis (n=8; 2.3±0.5 pmol/ml) without EA stimulation was used to calculate the percentage change in cGMP. Each bar represents the mean values and vertical bars represent S.E.M. Percentage change in cGMP levels from PC 4 dialysis was significantly higher than those of the non-meridian dialysate following EA PC 3 (unpaired t test; *: P<0.05).

