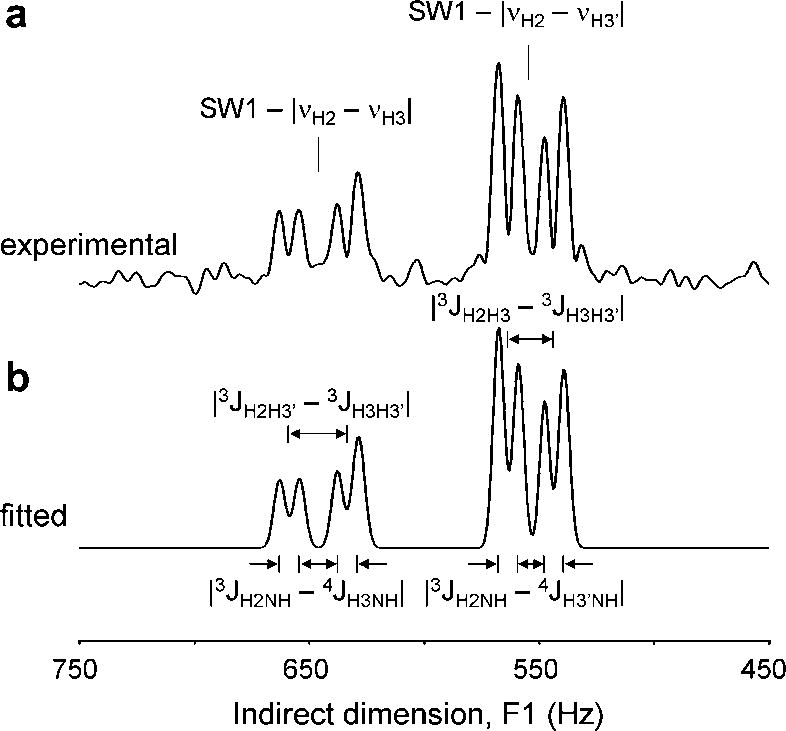
Figure 5.
(A) Absolute-valued projection onto the indirect F1 axis of the NAA spectral region of the 2D ZQC NMR spectrum shown in Fig. 4C. (B) Result of spectral fitting using eight Gaussian lines. The fitted spectrum reveals two absolute frequency differences and four absolute scalar coupling differences, as indicated. See text for details.

