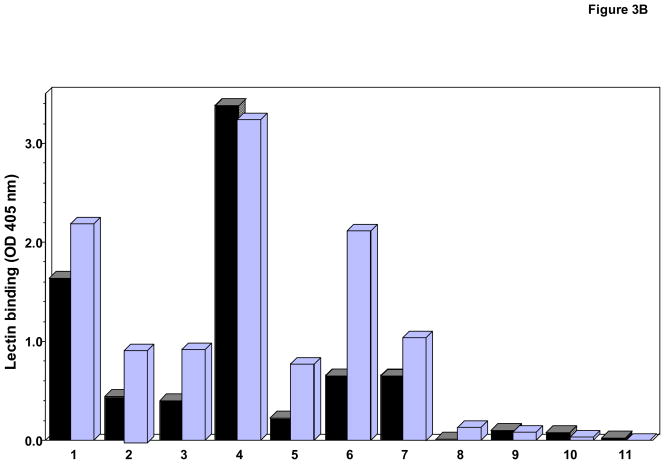
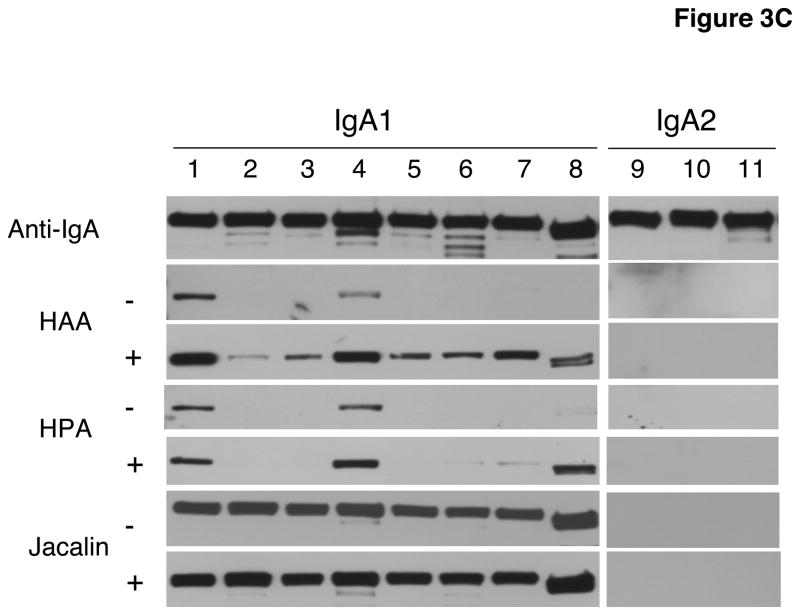
Fig. 3. Comparative binding of HPA and HAA binding in ELISA (A and B) and western blot analysis (C).
A) and B). Binding of HAA and HPA, respectively, to myeloma proteins (0.625 μg/ml) determined by capture ELISA. Proteins were native (black bars) or treated with neuraminidase to remove sialic acid (light bars).
C) One μg myeloma IgA1 and IgA2 proteins loaded per well. Membranes were not treated (−) or treated (+) with neuraminidase. Anti-IgA and jacalin were used as controls for loading and presence of GalNAc-Gal disaccharides, respectively. The same numbers identify the same proteins in A through C. IgA myeloma proteins used: (1) Mce, (2) Ham, (3) Ste, (4) Gou, (5) Lat, (6) Ber1, (7) Sin, (8) Kni, (9) Fel, (10) Ber2, and (11) Cob.


